Retail sales slow down in Vancouver over the past year due to housing downturn: report

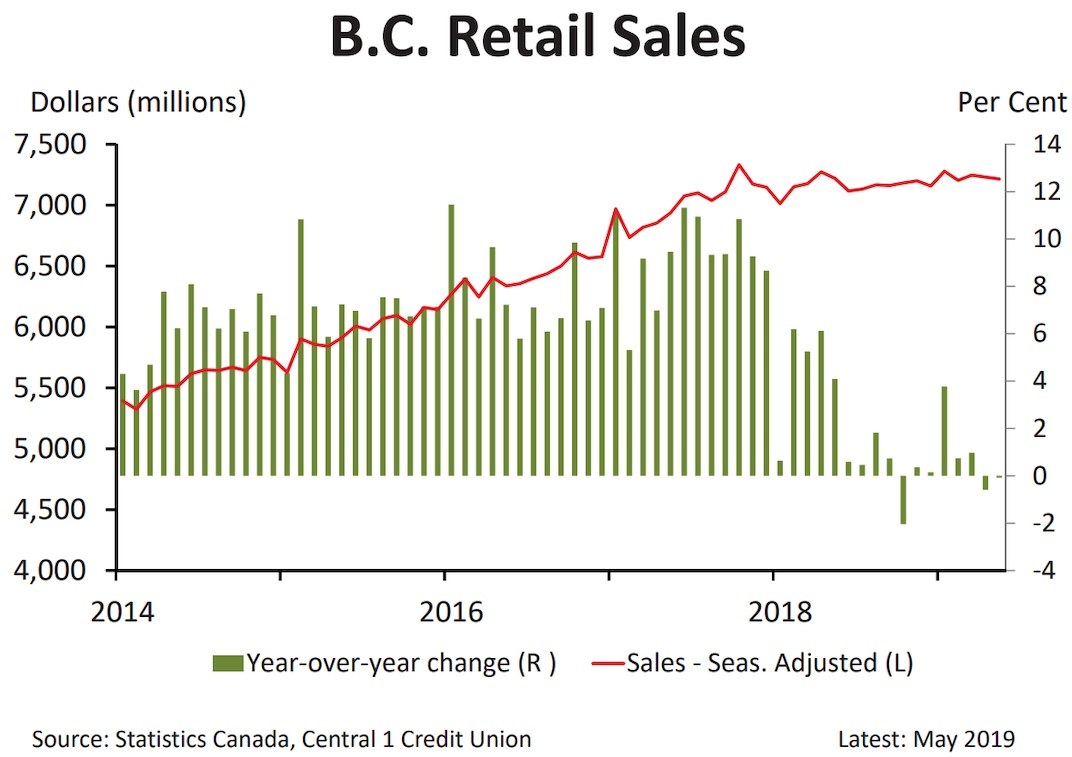
Retail sales in Metro Vancouver took a dip in May 2019 — an outlier amongst Canada’s three largest urban regions.
See also
- Pre-sales in Metro Vancouver's housing market dropped by 47% this year to date
- 1 in 5 new pre-sale condos released in the Lower Mainland in May sold: report
- Metro Vancouver's housing market has reached the 'cyclical bottom': report
- Vancouver's luxury housing market 'expected to regain momentum' this year: report
- Metro Vancouver's average home prices need to fall $795,000 to reach affordability
Statistics Canada released an update on the country’s retail trade last week, providing data for the month of May. While a 0.6% year-over-year decrease in the Vancouver region may seem insignificant, it starkly contrasts with the increases of 6% in Toronto and 5.2% in Montreal.
In real values, this translates into retail sales of $3.35 billion for Vancouver, $8.09 billion for Toronto, and $5.48 billion for Montreal.
In fact, this negative trend in Vancouver, contrary to the positive upticks in Toronto and Montreal, has been fairly constant for the past year:
June 2018
- Vancouver: -1.0% year-over-year; -2.1% month-over-month
- Toronto: +3.4% year-over-year; +2.0% month-over-month
- Montreal: +9.3% year-over-year; -0.3% month-over-month
July 2018
- Vancouver: -2.2% year-over-year; -1.6% month-over-month
- Toronto: +3.2% year-over-year; +0.2% month-over-month
- Montreal: +1.0% year-over-year; +10.2% month-over-month
August 2018
- Vancouver: -0.9% year-over-year; +0.9% month-over-month
- Toronto: +1.0% year-over-year; +0.3% month-over-month
- Montreal: +10.3% year-over-year; 0.0% month-over-month
September 2018
- Vancouver: -2.8% year-over-year; -1.2% month-over-month
- Toronto: +3.2% year-over-year; +0.7% month-over-month
- Montreal: +9.1% year-over-year; -1.4% month-over-month
October 2018
- Vancouver: -4.9% year-over-year; +1.1% month-over-month
- Toronto: +3.0% year-over-year; +1.8% month-over-month
- Montreal: +4.7%% year-over-year; -0.1% month-over-month
November 2018
- Vancouver: -1.4% year-over-year; +0.5% month-over-month
- Toronto: +2.6% year-over-year; -1.5% month-over-month
- Montreal: +3.8% year-over-year; -0.8% month-over-month
December 2018
- Vancouver: -0.3% year-over-year; -0.7% month-over-month
- Toronto: +3.8% year-over-year; -0.9% month-over-month
- Montreal: +5.6% year-over-year; +0.6% month-over-month
January 2019
- Vancouver: +0.9% year-over-year; +1.3% month-over-month
- Toronto: +2.3% year-over-year; -1.5% month-over-month
- Montreal: +2.3% year-over-year; -1.0% month-over-month
February 2019
- Vancouver: -3.1% year-over-year; -3.5% month-over-month
- Toronto: +2.1% year-over-year; +1.3% month-over-month
- Montreal: +11.3% year-over-year; +3.1% month-over-month
March 2019
- Vancouver: -1.2% year-over-year; +1.5% month-over-month
- Toronto: +7.9% year-over-year; +2.5% month-over-month
- Montreal: +7.8% year-over-year; +0.4% month-over-month
April 2019
- Vancouver: -4.4% year-over-year; -1.7% month-over-month
- Toronto: +8.5% year-over-year; +1.1% month-over-month
- Montreal: +6.7% year-over-year; -1.1% month-over-month
May 2019
- Vancouver: -0.6% year-over-year; +0.9% month-over-month
- Toronto: +6.0% year-over-year; +0.3% month-over-month
- Montreal: +5.2% year-over-year; +1.8% month-over-month
A new economic briefing report by Central 1 Credit Union that analyzes the statistical data correlates the poor retail performance with British Columbia’s depressed housing market.
“Weaker May sales reflected a decline in housing-related spending on furniture, furnishings, electronics, appliances, and clothing. Sales gains at general merchandisers and automobile sales following an April pullback offset some of the declines,” reads the report.
“Ongoing sluggish BC retail sales suggests a slowdown in consumer demand despite what has been strong labour market conditions and employment growth. The sharp decline in housing sales volume has been a driving factor of spending declines in related sectors, while lower prices may also be leading to spending belts being tightened.”
Other contributors to the retail sales slump include an 8.6% drop in automobile-related sales, possibly due to record-high gas prices experienced throughout the period.
The report notes that the strong labour market conditions “will remain supportive of retail sales activity, while the housing sales cycle has likely bottomed.”
Statistics Canada data also indicates retail e-commerce sales nationwide are up by 32.2% year-over-year for May, worth $1.35 billion. Overall, online sales represent 3% of total retail activity in the country.

BC retail sales performance. (Central 1 Credit Union)
See also
- Pre-sales in Metro Vancouver's housing market dropped by 47% this year to date
- 1 in 5 new pre-sale condos released in the Lower Mainland in May sold: report
- Metro Vancouver's housing market has reached the 'cyclical bottom': report
- Vancouver's luxury housing market 'expected to regain momentum' this year: report
- Metro Vancouver's average home prices need to fall $795,000 to reach affordability

