With more investment into bike lanes, bike parking, accessibility, and overall infrastructure, it doesn’t come as a surprise that the use of bikes in Downtown Calgary has significantly increased.
This may also be due in part to a number of contributing factors including rising gas prices, rising insurance costs, and people attempting to create fewer gas emissions when it can be avoided.
In 1991, the City of Calgary conducted a “Cordon Count” which collects and analyzes data from an enclosed area mapping different travel modes such as pedestrians, cyclists, transit passengers, vehicle drivers, and passengers entering the area. These tests are conducted (almost) every year, studying the shifts in transportation methods.
See also
- Check out these 10 Calgary startups at this year's Collision
- Instagram could permanently remove the number of likes on posts in Canada
- IKEA Canada has officially phased out all single-use plastic straws
The first recorded Cordon Count was conducted in 1991, showing 2,326 cyclists entering and exiting Calgary’s Central Business District on a regular weekday.
Following the 2018 Central Business District Cordon Count, the statistics showed that 18,117 cyclists per day entered and exited the same area in 2018. Within 27 years of tracking, there was a 679% increase in bicycle users.

This graph depicts the number of cyclists entering and exiting Calgary’s Central Business District on an average weekday (City of Calgary)
We can assume that since Cordon Counts annually take place on a weekday between 6 am and 10 pm, that many of the cyclists are travelling to and from work, opting for an environmentally-friendly way to travel.
The Cordon Counts take place over a three-week period in May. In the 2012 Modal Split, it showed that over the 16-hour period, 1.75% of all traffic was cyclists who entered and exited the CBD (Central Business District).
In 2018, under the same conditions, that number increased to 2.65%.
According to data taken between September and October, the 2018 Bike Volume Map shows waterfront locations to be more heavily concentrated with cyclists, with the exceptions to small sections of extremely central and populated streets in the downtown core.

This graph shows the highest concentration of cyclists (City of Calgary)
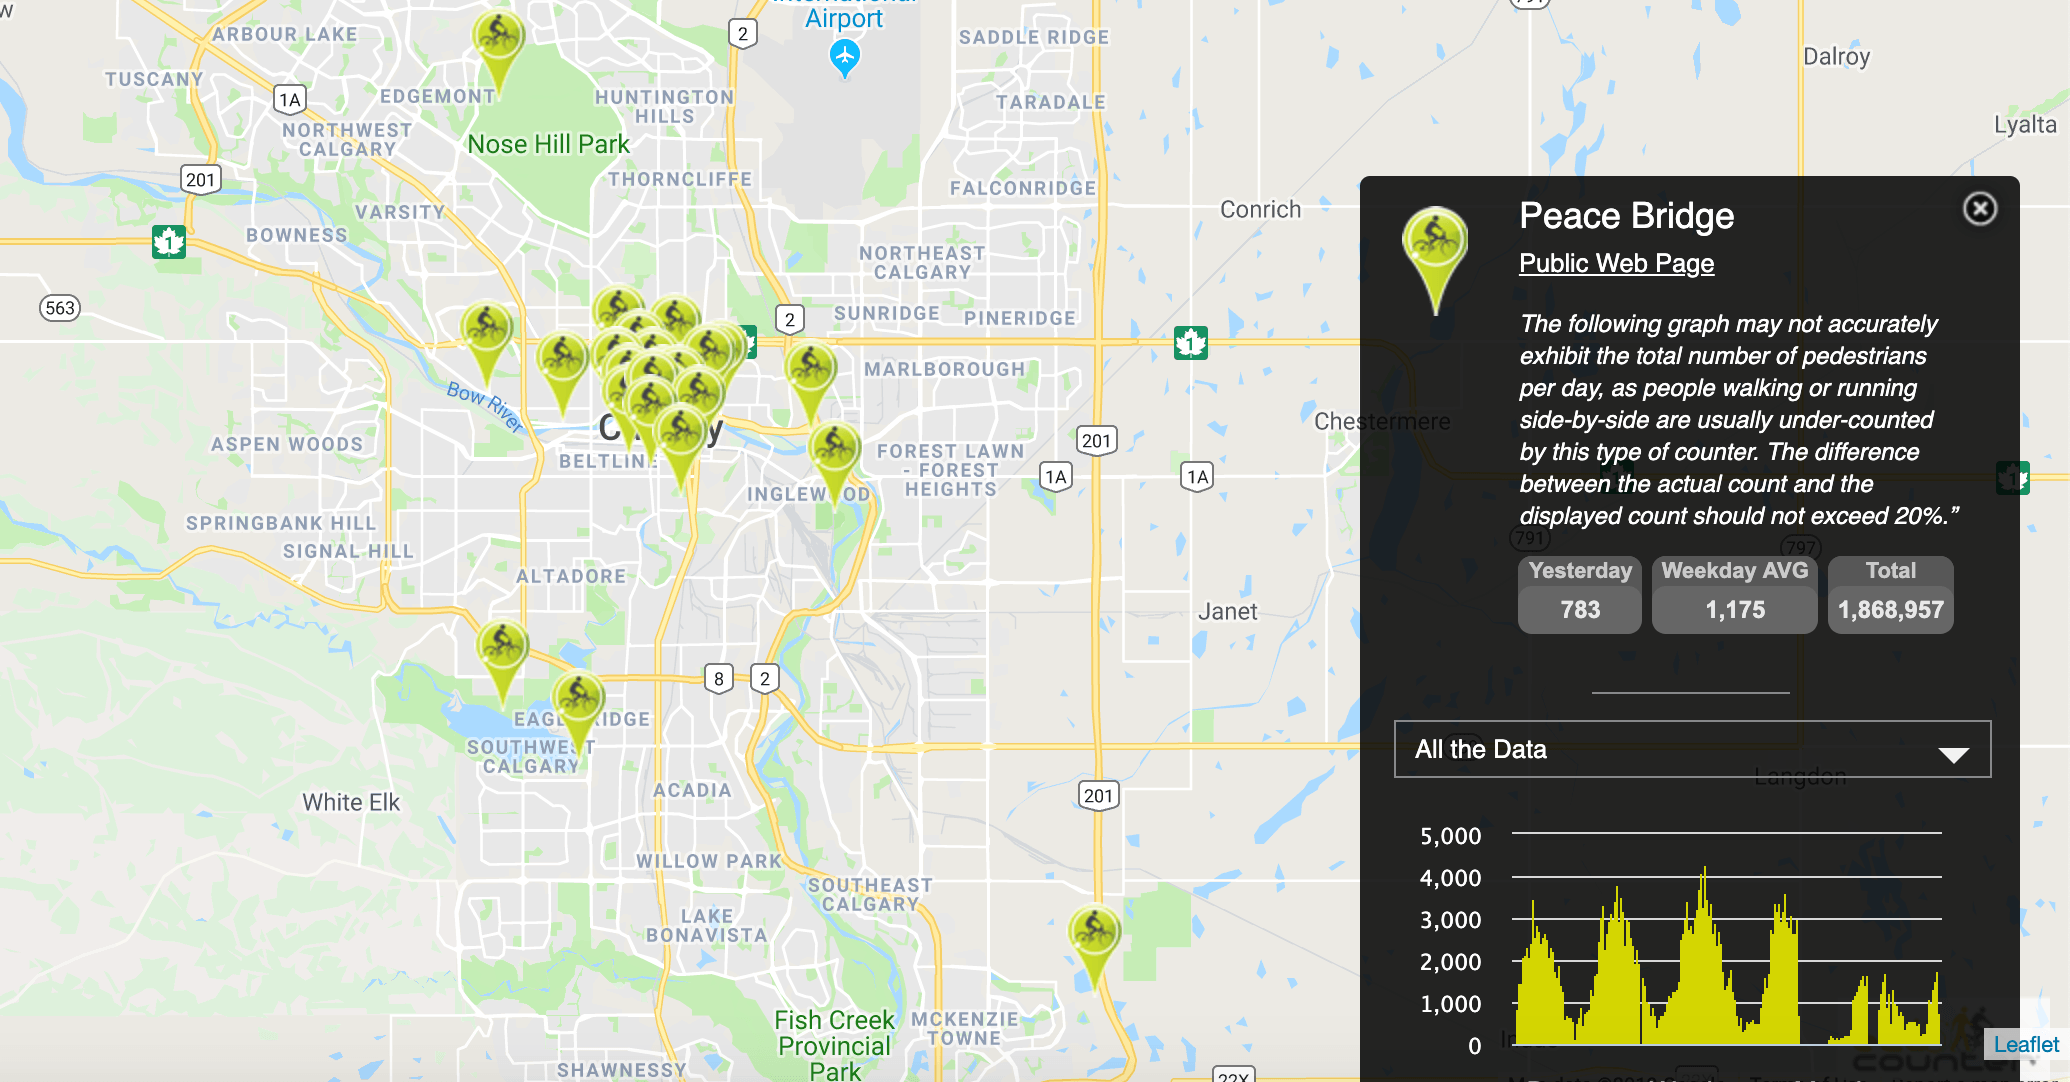
The City of Calgary has set up 28 sensor-counters that update in real-time, all while tracking and totalling the daily number of cyclists that pass by each sensor.
The sensors are set up in both bike-heavy and light areas to achieve an accurate count. The sensors also track pedestrian foot traffic and vehicles.

Daily bicycle sensors showing a real-time track of cyclists passing by (City of Calgary)
The 2019 Cordon Count is expected to begin within the month.

