
Improving the science: Mercadante develops new way of evaluating NHL goalies


Jonathan Quick and Corey Crawford have an easier job than Jonas Hiller and Karri Ramo.
Think about L.A. and Chicago’s rosters for a split second and you’ll realize the statement is so obvious it verges on pointless. Defensive cores led by Norris candidates Drew Doughty and Duncan Keith and lineups filled with skilled, responsible players make for a cushier life in net.
See, Cup contenders allow a smaller percentage of high quality shots to low quality ones. This means a greater proportion of the shots Quick faces are easier to save outside shots, while Hiller faces more tougher-to-save point-blank shots.
This raises the question – why are all shots measured equally when evaluating goalies?
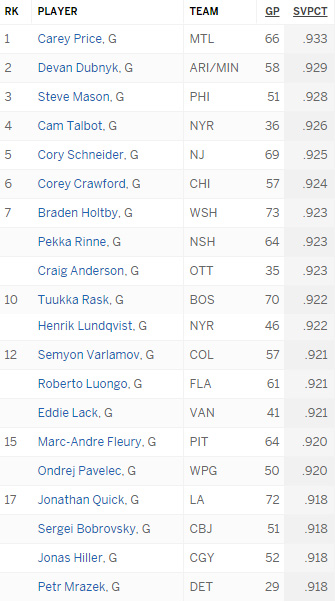
Save percentage, the standard way of comparing goaltenders, uses a simple calculation – saves/shots faced. Considering varying degrees of difficulty, using this to compare goalies on different teams is not remotely fair.
Another thing – Devan Dubnyk’s current .919 save percentage doesn’t mean he’s the modern day Dominic Hasek – who had a .919 save in 1999. Looking at a goalie’s save percentage without comparing it to other current ones is a waste of time.
With this in mind, Nick Mercadante of hockey-graphs.com has been developing a more accurate, easier to understand method of measuring NHL goaltenders’ performances.
His goalie metric, currently known as “Mercad” builds off war-on-ice.com’s adjusted save percentage, which takes into account where on the ice shots are being released from. He removes special teams stats because they skew the results and converts it into a rate stat (per 60 minutes) so goalies who play more and thus amass more saves don’t look better.
Finally, it compares a particular goalie’s numbers to the league average. With goaltenders getting better every year, looking at a save percentage or even an adjusted save percentage is pointless unless you’re looking at the stats of others.
The result of comparing to the league average is either a positive or negative number, meaning you can clearly see if a goaltender is doing better or worse than others playing the same position in the same year.
This is how the stat looked for NHL goalies who played at least 1200 minutes (20 full games) last season.

Image: Nick Mercadante
As you can see, the rankings don’t align with their save percentages.
People looking to poke holes in the measurement (which is exactly what should happen in order to make it stronger) have brought up two big issues. First, some experts believe goaltenders would rather face shots from the slot than unpredictable outside shots from tough angles.
Speaking with Mercadante over the phone last week, he says he understands and has investigated the theory but the stats don’t bear it out.
“High danger shots are going in more often,” he says.
The second objection he’s heard is that many goalies say facing more shots keeps them engaged. “Pekka Rinne said himself, ‘When I’m locked in and I’m getting a lot of shots, I’m on my game.’”
Again, Mercadante says the numbers disagree: “At the end of the day statistically, there’s no correlation between your total shot count and your performance,” he says.
“It’s all over the place, so the guy who faces 35 shots, the guy who faces 28, there’s no correlation to their performance.
“There is a correlation based on the danger zone – the location of the shot. What we’re finding is high danger shots go in more often. That’s the reality.”
Refining the measurement
While the “Mercad” measurement is already an apparent improvement on the currently used save percentage, Mercadante and his hockey-graphs.com colleague Matt Cane are working on a refined version called DAGS, or Data Adjusted Goals Saved. One major addition he will be adding is an adjustment for score state.
Those who are into advanced statistics will understand this, but for those who don’t – teams play differently based on the scoreline in a game. If a team is down 1-0, they tend to press harder and attempt more shots, while the team holding a lead will tend to sit back.
So if you looked at shot attempts (AKA Corsi) for a game where one team led the entire way, it may look as if they were outplayed. In reality, they may have done just enough to get the lead and then gone into a defensive shell to hold it – thus the need to adjust for score state.
Similarly, Mercadante says, score states impact the performance of a goaltender.
“In certain situations goalies on average do better or worse than in other situations,” he says.
Given the chance to elaborate, Mercadante didn’t want to give away too much as he plans to publish his findings shortly, but he did say this: “(The findings) will kind of surprise you because you would think a goalie in a tied score state or up one would have a lower save percentage because the other team’s pressing more or because they’re nervous – I don’t know, they might have the jitters. But it’s kind of the opposite.”
Dealing with prospects
While improving the way we analyze current NHL goalies will certainly give us better insight into how they’re playing, the area where advances could really help is in understanding prospects.
This chart displays goalies from the 2009-12 drafts who’ve had NHL success.
| Draft Year | Name | Rd | Overall Position |
| 2009 | Robin Lehner | 2 | 46 |
| 2009 | Darcy Kuemper | 6 | 160 |
| 2010 | Petr Mrazek | 5 | 141 |
| 2011 | John Gibson | 2 | 39 |
| 2012 | Andrei Vasilevskiy | 1 | 19 |
| 2012 | Frederik Andersen | 3 | 87 |
| 2012 | Connor Hellebuyk | 5 | 130 |
| 2012 | Linus Ullmark | 6 | 163 |
Looking at the list you might think you’d have a better chance of hitting a target playing darts with your feet than a GM has of successfully drafting a goalie.
Mercadante says it’s not possible to use “Mercad” or “DAGS” on CHL or AHL goalies because data on shot locations is not recorded. He does, however, think goalie scouting can be improved.
“To be honest with you, a lot of the scouts aren’t goalies, so they don’t understand how to analyze goalies,” he says.
“It’s a matter of what we’re scouting for and how we identify success. The key is to find out what makes an NHL goalie successful and to look for those attributes.
“You hear scouts talking about goalies saying stuff like, ‘He’s great on the first shot.’
“What does that mean? Does it mean he’s getting out and covering his angle line? What’s his depth in relation to that? Is he playing deep? Is he playing aggressively? If he’s playing over aggressive is that going to screw him up for rebounds at a higher level where they’re not shooting right into your chest?
“All those things are follow up questions they never seem to have the answer to.”
As the science of goaltending continues to develop, the answers are coming. Mercadante and his colleagues will be the ones pushing for more.