


Earlier this week, Jim Benning said Vancouver had kept the the Islanders’ shots mostly to the outside (on sports radio).
Clearly he does not pore over the numbers on the many hockey analytics sites out there, and maybe he’s better off this way.
See, the Canucks are 3-1-1 on their current road trip, and sport a 8-3-3 record since Ryan Miller was injured just before Christmas. Those are happy thoughts. That they’ve been outshot 207-125 in the past five games, or 453-331 since December 22 (they’re high quality shots from dangerous locations), are not.
Now, change is apparently coming, as we see from Brandon Prust being scratched for Mike Zalewski. More importantly, when Henrik Sedin, Brandon Sutter, and Dan Hamhuis return from injuries, the numbers should improve.
Keeping that in mind, we’re going to be nerds and look at some of the numbers the Canucks have put up so far this season. Just be prepared for unhappy thoughts.
Corsi-for percentage
Looking at a team’s corsi-for percentage tells you which end of the rink they’re spending more time in. If it’s above 50 per cent, they’re playing in the offensive zone more.
We probably don’t have to tell you Vancouver’s corsi-for percentage is not above 50 per cent. It’s below. Actually, it’s one of the worst corsi-for percentages in the NHL this year.
Worse, it’s one of the worst corsi-for percentages in the past two seasons, putting the Canucks near the futility of Toronto last year and below Buffalo this year.
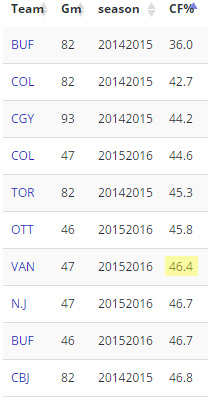
(these are score-adjusted even-strength numbers, from war-on-ice.com)
Scoring chances against
Rhys Jessop (of hockey-graphs.com) recently brought up the scoring chances against Vancouver, and wasn’t exactly on the same page with Benning’s assertion that the shots were being kept to the outside.
Jessop argued (on TSN 1040 Tuesday morning, and on Twitter) the Canucks are historically bad at allowing scoring chances – shots from high danger zones on the ice (not the outside).
Looking into it, the Canucks are allowing the highest number of scoring chances against of any NHL team this season. That’s bad.
But it’s worse than that, as Jessop pointed out.
Here’s a list of the worst teams in terms of scoring chances against, since two seasons ago.

We’re looking at the SCA60 column which means “Scoring chances against per 60 minutes” because it allows us to compare numbers from this incomplete season to prior seasons.
Yes, those are the Oilers, Leafs and Sabres teams of the past two years right next to them.
Faceoffs
Faceoffs take no explanation. They’re not an “advanced stat” and everyone understands that winning faceoffs and having possession of the puck is a good start.
You’re also probably aware that Vancouver’s bad at faceoffs. You may have even heard they’re the worst in the NHL right now.
But did you realize they’re one of the worst faceoff teams in the last 10 years?
You can see it in this chart from war-on-ice.com:
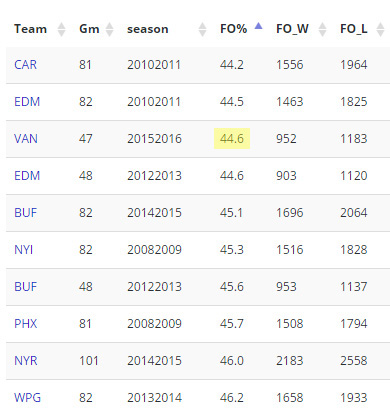
To give you some perspective, here’s how the other nine teams on this list ranked in the overall points standings at the end of those seasons.
| 2010-11 Carolina | 19 |
| 2010-11 Edmonton | 30 |
| 2012-13 Edmonton | 24 |
| 2014-15 Buffalo | 30 |
| 2008-09 NYI | 30 |
| 2012-13 Buffalo | 23 |
| 2008-09 Phoenix | 25 |
| 2014-15 NYR | 1 |
| 2013-14 Winnipeg | 22 |
While the Rangers of 2014-15 might give you hope that a team can be terrible at draws yet great at hockey, the rest of the teams should show you teams bad at faceoffs are bad.
Whether a team has less success because they’re losing faceoffs or is bad at faceoffs because they have less skill at centre is another conversation.
While newcomer Mike Zalewski did well in the circle going 5-2 on faceoffs against Boston, everyone except Jared McCann won more than they lost, so it may just be an anomaly.
The AHL doesn’t keep track of faceoff numbers but according to our prospects expert Ryan Biech, he’s “okay” at them.
Hey, it’s a lot better than historically bad.