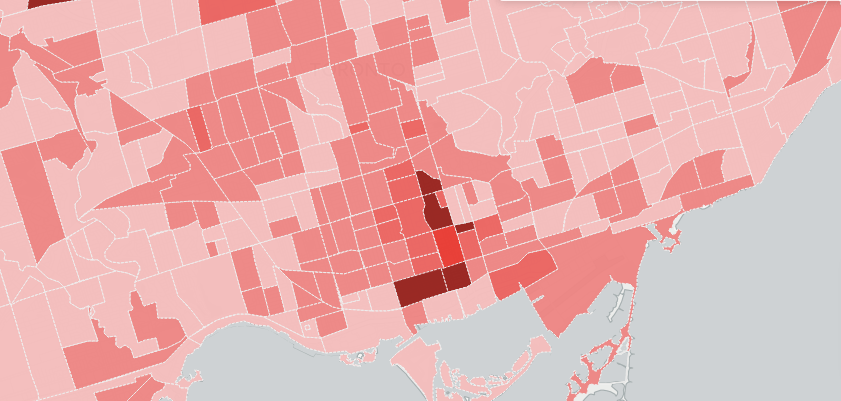
Interactive map shows percentage of unoccupied homes in Toronto in every neighbourhood

We all know the real estate market in Toronto is tough.
From high demand to low supply, the costs keep rising, and the reality of purchasing a home in Toronto seems more and more difficult.
Interestingly enough, new data from Statistics Canada show that 99,236 homes in Toronto are not regularly occupied, according to Better Dwelling.
Toronto has homes so nice, people buy them twice apparently. #toronto #realestate https://t.co/tcDzOVCITP
— Better Dwelling (@BetterDwelling) February 9, 2017
The real estate blog took the stats, and have created an interactive map that shows which areas have the highest irregular occupancy in Toronto.
Not surprising, the city’s downtown core had the highest percentage of irregular occupancy, with the financial district being the highest at 29 per cent of homes not regularly occupied.
Check out the map for some surprising data.
Better Dwelling
See also

Follow Channels and Categories