Google Maps releases data on how physical distancing is changing our behaviour

Google is putting its Maps location data collection to good use by showing public health and government officials the effectiveness of physical distancing and self-isolation measures in the fight to prevent the spread of COVID-19.
This activity data on mobile devices is aggregated and anonymized, typically to show how busy certain types of businesses are, such as shops, restaurants, and attractions.
- See also:
The first set of the company’s COVID-19 Community Mobility Reports, showing population behaviour as of the end of March, provides insights on what has changed in response to work from home, shelter in place, and other policies intended to help flatten the curve in the number of coronavirus cases.
The reports cover 131 countries and regions, including a breakdown of Canada as a whole, and each province and territory. Google plans to update its data over time to illustrate how trends may change over weeks.
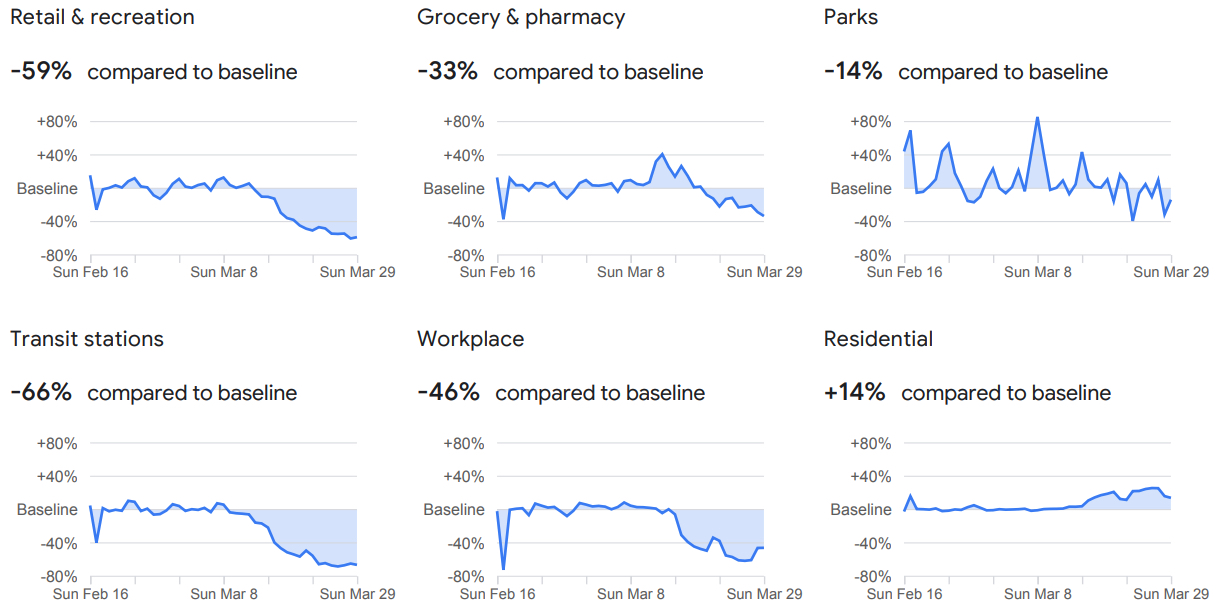
Here is a breakdown of how mobility trends have changed across the country between the baseline of February 16 and March 29:
- -59%: Retail and recreation, including shops, malls, restaurants, cafes, theme parks, museums, libraries, and movie theatres
- -35%: Grocery and pharmacy, including grocery markets, food warehouses, farmers’ markets, specialty food shops, drug stores, and pharmacies
- -16%: Parks, including national parks, public beaches, marinas, dog parks, plazas, and public gardens
- -66%: Transit stations, including subway, bus, and train stations
- -44%: Workplaces: mobility trends for places of work
- +14%: Residential: mobility trends for places of residence
All provinces saw a significant spike in trips to the grocery and pharmacy in the middle of March, when concerns over the pandemic grew and governments began enacting physical distancing measures. It was during this period when workplace and transit station trends also saw a dive.
Despite calls for the public to make only essential trips, in BC, New Brunswick, Newfoundland, and Nova Scotia, trips to parks spiked.
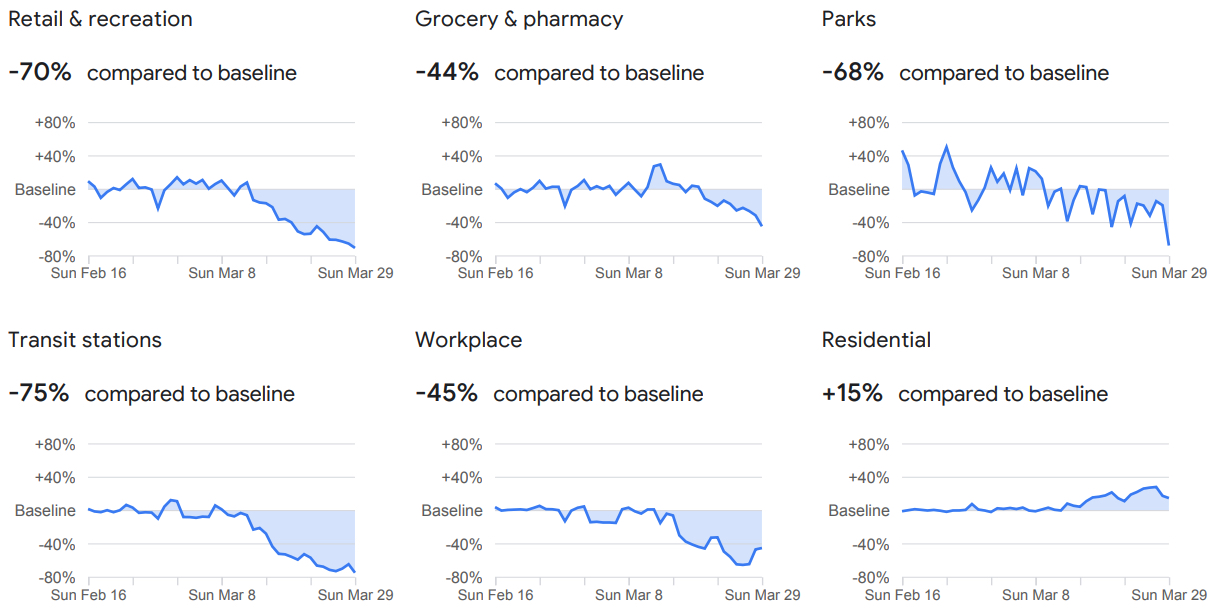
Here is a breakdown of the mobility trends in the key Canadian provinces:
British Columbia

COVID-19 Community Mobility Reports, March 29, 2020. (Google Maps)
Alberta

COVID-19 Community Mobility Reports, March 29, 2020. (Google Maps)
Ontario
COVID-19 Community Mobility Reports, March 29, 2020. (Google Maps)
Quebec
COVID-19 Community Mobility Reports, March 29, 2020. (Google Maps)

Follow Channels and Categories